- Opening Bell Daily
- Posts
- How housing inventory has changed since the pandemic
How housing inventory has changed since the pandemic
3 charts illustrate how a handful of US states have finally returned to pre-COVID levels.


Phil Rosen & Lance Lambert
September 26, 2024

Happy Friday eve! We learned this week US home prices have hit a new record high, according to the Case-Shiller index, increasing 5% in July 2024 compared to last year.
With that in mind, I reached out to Lance Lambert — the nation's foremost data journalist and beat reporter in the residential real estate space — to share an update on the state of the housing market.
Today’s letter is brought to you by iTrust!

Bitcoin has been one of the best investments of the last decade, but traditional exchanges mean hefty taxes. If you open an account with iTrust Capital, you gain tax-advantaged benefits to help you:
Save on taxes
Invest in crypto
Supercharge retirement
The best investors understand the power of an IRA. Open one today from iTrust Capital.
An inventory update in 3 charts
Lance Lambert is the co-founder and editor-in-chief of ResiClub, a media and research company dedicated to in-depth tracking, reporting, and analysis of regional housing markets. He is the former real estate editor of Fortune Magazine.
When assessing local home price momentum, it's important to monitor active listings and months of supply. If active listings rapidly increase as homes stay on the market for longer, it could indicate future home price softness or declines.
Conversely, a rapid decline in active listings could suggest a market that is heating up.
Generally, local housing markets where active inventory has returned to pre-pandemic levels have experienced softer home price growth (or outright price declines) over the past 24 months.
By comparison, local housing markets where active inventory remains far below pre-pandemic levels have, generally speaking, experienced stronger home price growth over the past 24 months.
National active listings are on the rise (+36% between August 2023 and August 2024); however, we’re still well below pre-pandemic levels (-26% below August 2019).*

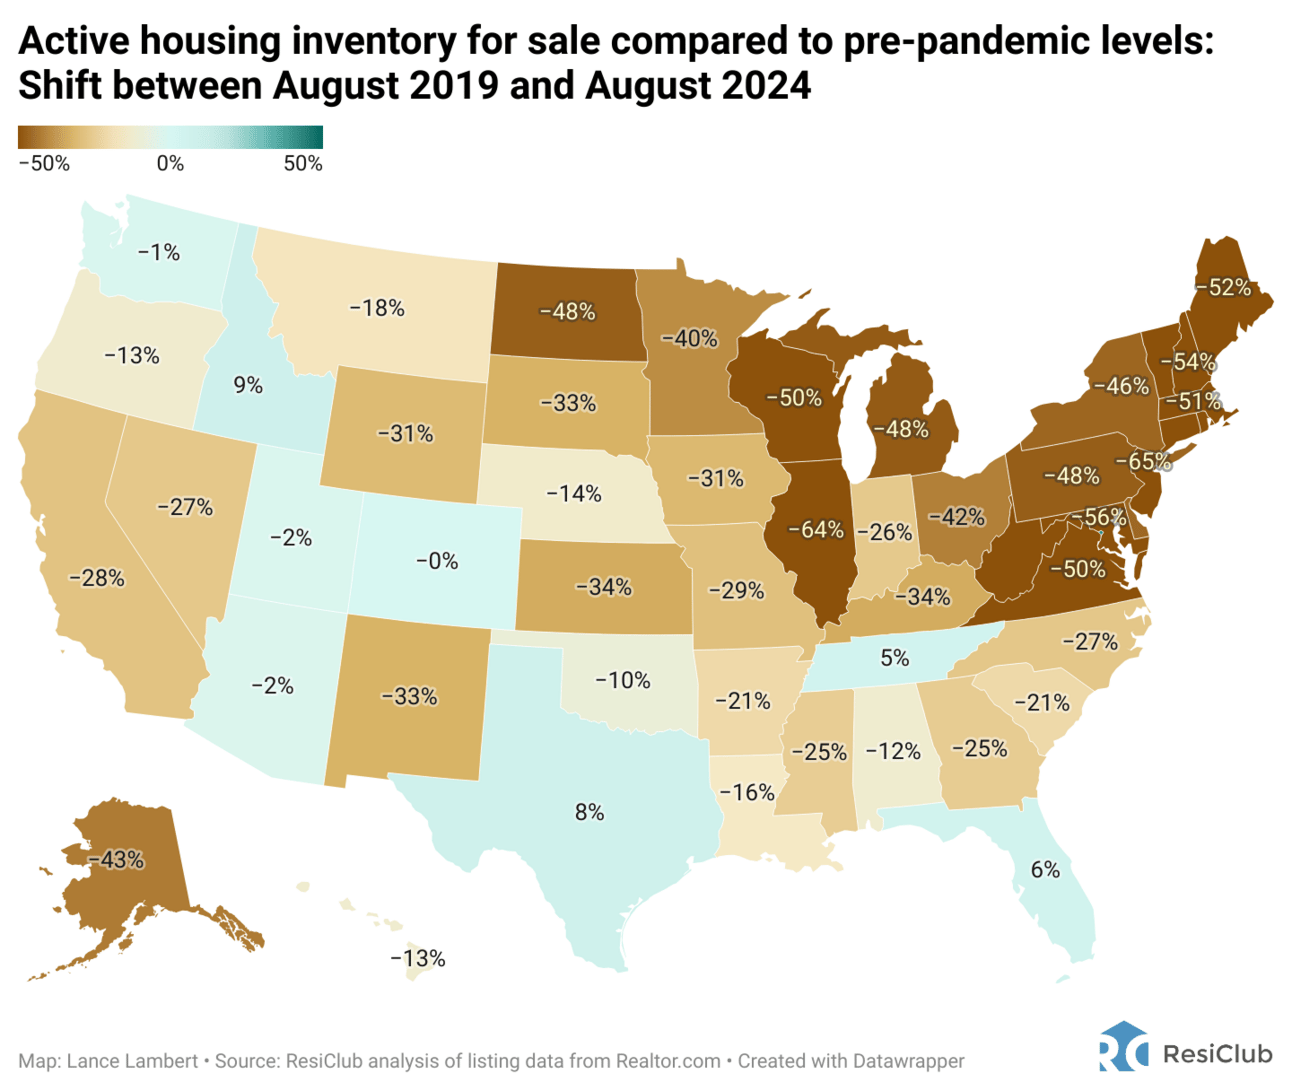
Click here to view an interactive version of this map
So far, four states have returned to pre-pandemic 2019 inventory levels:
Florida
Idaho
Tennessee
Texas
States that will likely soon join that list:
Colorado
Washington
Utah
Arizona
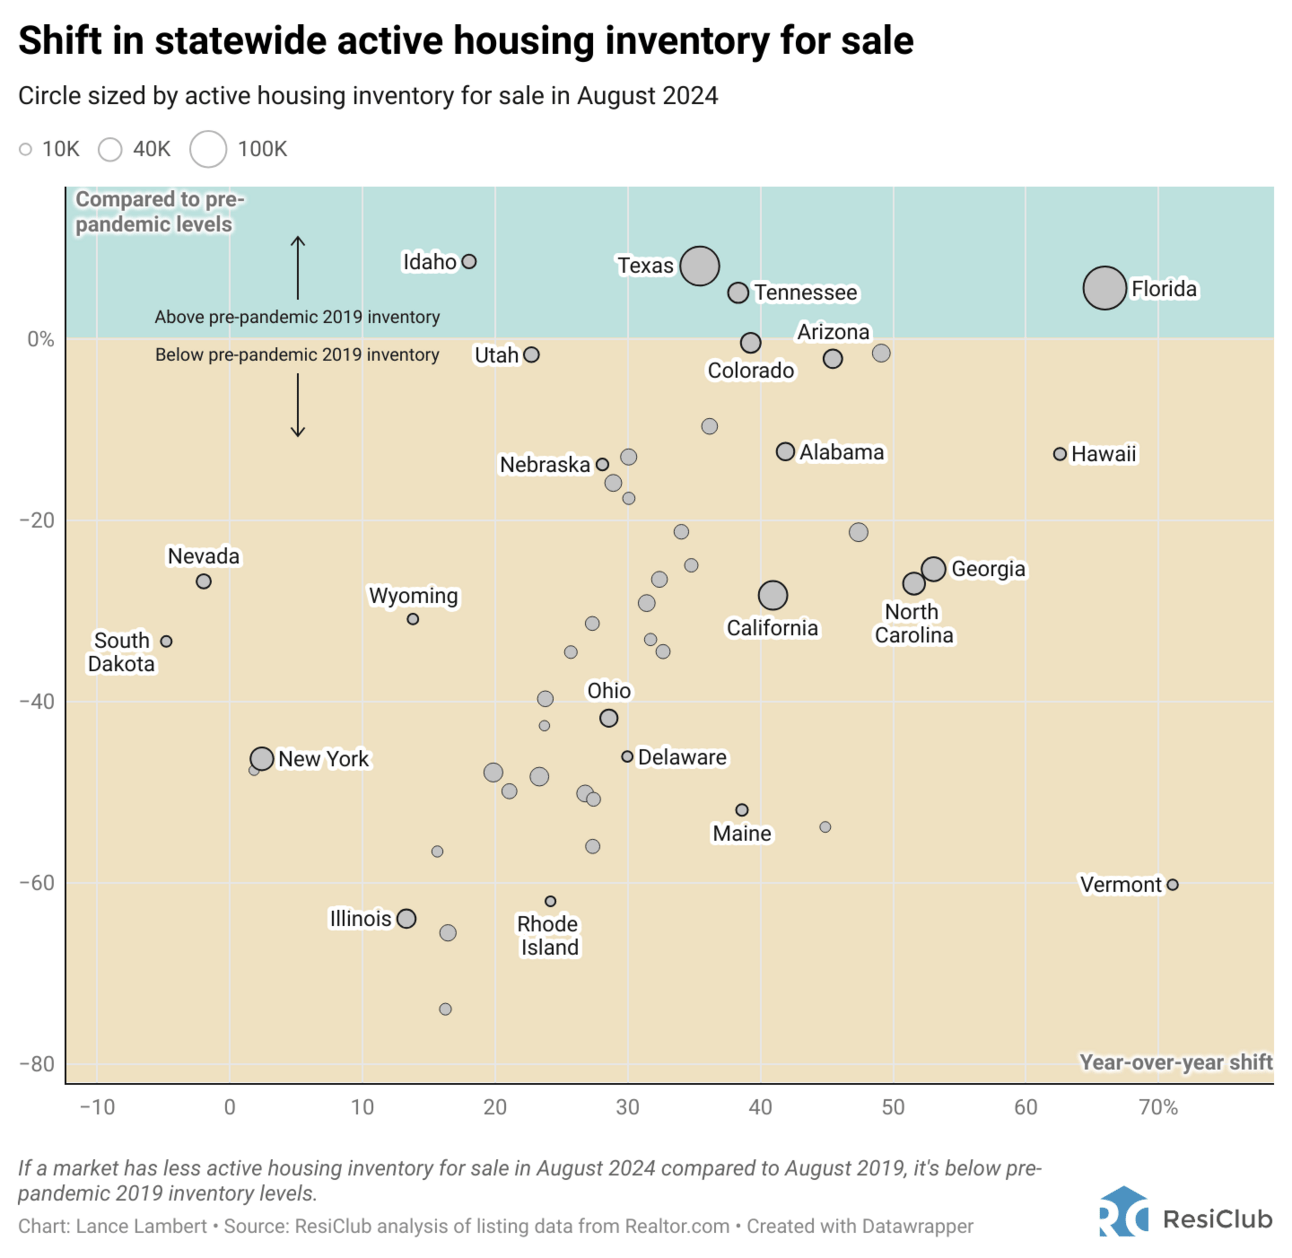
Click here to view an interactive of this chart
Why are Sun Belt and Mountain West markets seeing a faster return to pre-pandemic inventory levels than many Midwest and Northeast markets?
Some pockets of the Sun Belt and Mountain West experienced even greater home price growth during the Pandemic Housing Boom, which stretched affordability fundamentals too far beyond local incomes.
Once pandemic-fueled migration slowed and rates spiked, it became an issue in places like Boise and Austin.
Unlike many Sun Belt housing markets, many Northeast and Midwest markets have lower levels of homebuilding.
As new supply becomes available in Southwest and Southeast markets, and builders use affordability adjustments like buydowns to move it, it’s created a cooling effect in the resale market.
The Northeast and Midwest don’t have that same level of new supply, so resale and existing homes are effectively the only game in town.
Most regional housing markets are still seeing positive year-over-year home price growth.
The big question going forward is whether active inventory and months of supply will continue to rise and cause more housing markets to see outright price declines.
Note: All the charts above show active listings, or everything currently for sale. Actives are rising year-over-year because demand has cooled and homes are taking longer to sell—not because there’s a surge in new listings.
Comments, contentions or feedback? Reply to this email or reach out to Lance directly on X @NewsLambert. You can see more of Lance’s work on ResiClub.

Elsewhere:
🇨🇳 China isn’t done stimulating. After announcing multiple interventions earlier this week, Beijing is now considering injecting $142 billion of capital into its largest state banks. In theory, that would improve lenders’ capacity to help the struggling economy. The details have yet to be finalized, but if confirmed it would mark the first capital injection into banks for China since 2008. (Bloomberg)
🏦 Wall Street and the Fed disagree on rate cuts. Policymakers intend to lower interest rates at a gradual pace after the first jumbo cut. On the other hand, markets appear to be betting that worsening economic conditions will force the central bank to move much faster. The September and November jobs reports will say who’s correct. (Barron’s)
📊A boring stock market looms. Now that the Fed has kicked off its rate-cutting cycle, investors are poised to benefit from the lack of uncertainty ahead. With few notable macro data points to report, the biggest catalyst for traders will be election day. That means tepid volatility and trading. When it comes to investing, no news is good news. (Opening Bell Daily)
Rapid-fire:
Oil prices tumbled for a second day in a row as Saudi Arabia is reportedly weighing an increase in output (Bloomberg)
ChatGPT creator OpenAI will convert from a non-profit to a for-profit company (WSJ)
Bernard Arnault added $6 billion to his net worth in one day after China’s stimulus sparked a rally in luxury stocks (Business Insider)
The US and its allies called for a 21-day ceasefire between Israel and Hizbollah (FT)
Vietnam says Elon Musk’s SpaceX has proposed a $1.5 billion investment in the country related to satellite service (Bloomberg)
Wall Street and the Fed disagree on how fast interest rates will fall (Barron’s)
Last thing:
Great quote from Druck
— Will (@WClementeIII)
4:38 PM • Sep 24, 2024
Interested in advertising in Opening Bell Daily? Email [email protected]
Reply